Tracing Meteor applications with OpenTelemetry Technical
When optimizing a single-page web application for faster response times, it’s often invaluable to understand what your application is waiting for. Distributed Tracing is a way of collecting and visualizing the flow of a request from the front-end as it flows into and between back-end services.
Distributed traces are often a core part of Application Performance Monitoring (APM) tools. Products like Datadog APM and Sentry can gather traces centrally and also aggregate them into high-level metrics for Throughput, Errors, and Latency (sometimes referred to as RED metrics).
Unfortunately, applications built with Meteor.js have been isolated from these APM tools due to incompatibilities with the vendors’ libraries.
To address this gap, I’ve published an experimental Meteor package which integrates OpenTelemetry-JS with Meteor concepts such as Fibers, DDP method calls, and Mongo queries. This module can be used to quickly set up browser-to-server tracing in a Meteor 2.x application.
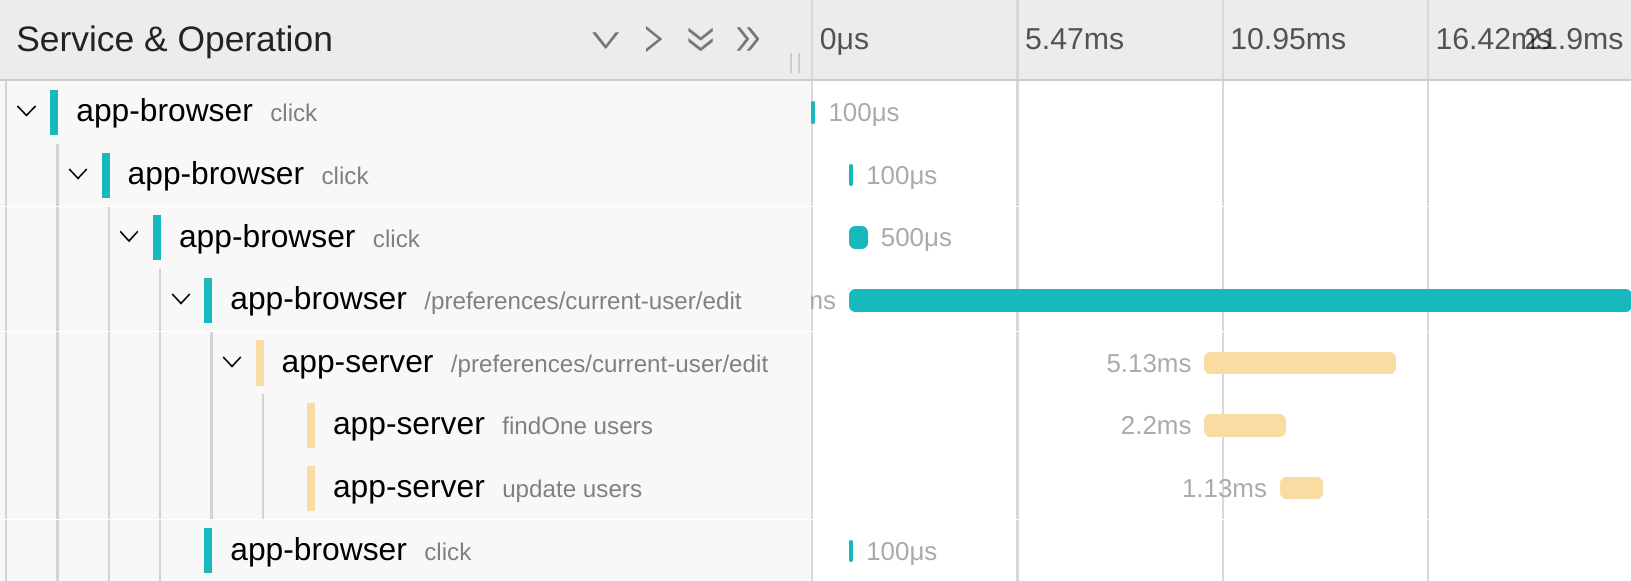
Now a button click can be traced through to a database query:
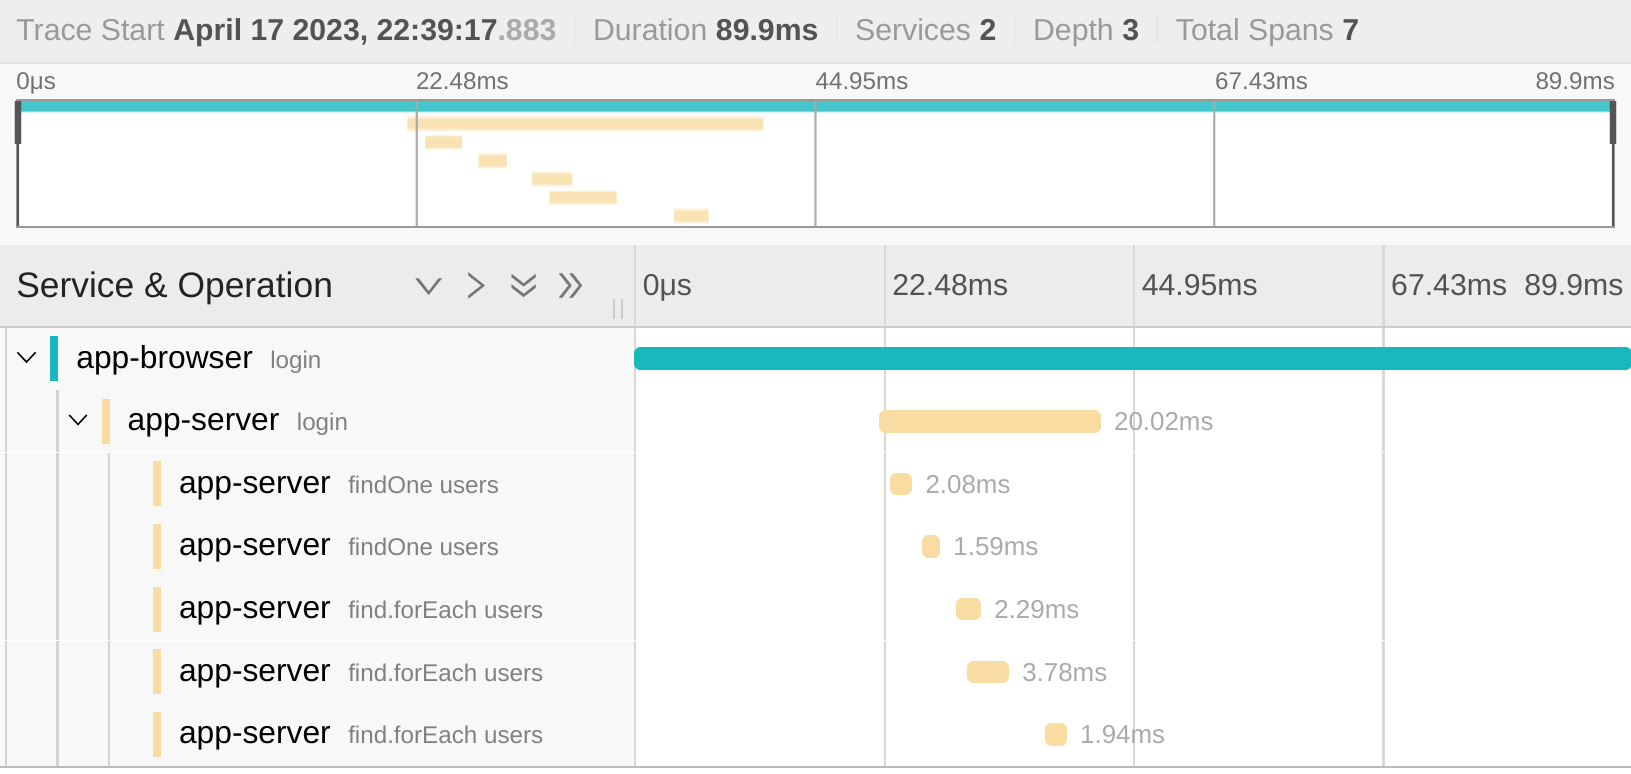
And the actions taken by complex Meteor methods can be more easily understood:
Why Meteor struggles with Tracing
For some quick historical context: The Meteor.js web framework was created in 2011, a time when asynchronous NodeJS applications suffered from “callback hell”. Years later, Javascript gained async/await capabilities, but in the meantime Meteor used Fibers to achieve a similar effect.
More recently, tracing libraries have popped up which use Node’s Async Hooks module for managing trace context. The problem arises when Meteor’s Fibers and Node’s Async Hooks are combined in the same program. NodeJS will lose track of what’s executing! Since each APM vendor provides their own libraries and APIs, it’s infeasible to provide a single patch to integrate them with Meteor.
Fortunately, there’s now a vendor-agnostic tracing option: OpenTelemetry defines an open API and protocol for recording traces, metrics, and logs to a number of platforms. Now we can instrument specific runtimes once—like Meteor + Fibers—and transmit the gathered data to any of the APM tools which accept OpenTelemetry. The danopia:opentelemetry Meteor package has been tested with various vendors including Datadog, Honeycomb, Google Cloud Trace, and Elastic APM.
Using OpenTelemetry for a Meteor App
There are a few steps to enable tracing:
- Install a Meteor/OpenTelemetry integration package:
meteor add danopia:opentelemetry
- Set up OpenTelemetry NodeJS instrumentation at the top of your server module
- [optional:] Import
meteor/danopia:opentelemetryat the top of your client module, and set up any extra instrumentation such as userinteraction or documentload - Add OpenTelemetry environment variables and settings to your server
Details (including example code) available in the project README.
If you encounter any issues using this library, feel free to open a Github issue.
Instrumenting Meteor for Tracing and Metrics
There are a few unique aspects of Meteor that are relevant when instrumenting applications. These are all things that are accounted for in danopia:opentelemetry.
Storing Trace Context (on the server)
Automatic tracing works by storing the “trace context” associated with a particular asynchronous execution in the runtime’s state. Instead of Async Hooks, Meteor provides an EnvironmentVariable class which stores data directly on Meteor’s Fiber object. I found this quite easy to work with and quickly developed a MeteorContextManager class for OpenTelemetry’s SDK to use.
Note that in-browser async contexts are not very accurate. This is a general browser problem with code awaiting Promises. There’s some possibilities of improving browser context tracking e.g. with zone.js, however I have not looked into this yet.
Propagating Traces through DDP
Meteor applications are not generally REST-based. Meteor instead uses a WebSocket (or long-polling) for client-to-server RPC calls and subscriptions. In order to achieve client-to-server tracing, the trace context needs to be included in the RPC calls.
When danopia:opentelemetry is installed, the client’s DDP requests are automatically annotated with a trace context. This is accomplished by adding a new field to outgoing DDP messages. Now it’s clear how much time was spent on network latency vs. server delay.
Submitting Traces
OpenTelemetry has a ‘collector’ program which is able to receive OTLP traces from browsers. I found some concerns with having a collector directly on the Internet, and instead defined several DDP methods for receiving OTLP payloads. These methods are also exempt from tracing.
Clock Synchronization
While technically just a nuisance, misaligned trace spans between the browser and server sides eventually got to me. I was frequently seeing offsets of around a second or so. I set up a very basic server/client ping to try keeping spans in sync. Within a datacenter, system clocks themselves should be synchronized, but browser apps can’t expect every device to be lined up.
MongoDB Instrumentation
OpenTelemetry can inject trace spans into the mainline MongoDB driver, but I had trouble tying those automatic spans into the app’s Meteor code. I instead reinstrumented Meteor’s MongoDB API. I’m sure that this is non-ideal and am open to adjusting how queries become spans.
Try it out! Report back!
I hope that this new observability package for Meteor applications proves useful to others!
As a final node, Meteor 3 (when it’s released) will include some new work on migrating Meteor off of Fibers. The migration timeline is still a bit unclear, but it’s possible that once Meteor 3 comes out, other APM libraries will also work for Meteor applications (though without things like DDP context propagation). Only time will tell how well that migration goes.